The Assets Module contains the options that allow us to change the way the map displays and visualises device / Asset data.
An Asset is an icon on the map, it typically represents a trailer or a truck, it can represent many other things too.
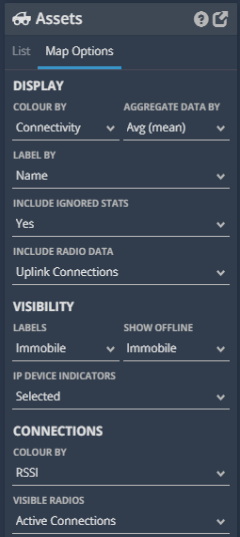
Asset Colouring is a quick way to see how that Asset is performing, we have adopted the traffic light system to help keep it simple, red for bad, green for good. You can use the Colour By drop-down to choose how you would like the Assets coloured. You can also change the way assets are Labelled By on the map, either the asset name or the value of the statistic used to colour the asset.
Choosing the way in which IMS Aggregates Data By, can mean the difference between seeing the average for the data sample (typically 8 seconds) or showing the maximum or minimum during that same period.
Asset Visibility options allow the user to toggle extra data visualisation features on or off, such as Asset / IP Device Labels, this allows a user to see the names of all Assets or only certain groups. By choosing to Show Offline Assets, a user can customize whether all Assets, regardless of state/delay are shown, or whether things like towers/trailers that are offline are shown.
IP Device Indicators toggle tiny indicator dots on Assets to represent the data from an IP Device on an Asset’s icon. Connections represent the options that control the way in which an Asset’s connection lines and chipset data are shown, typically between one Asset and another. Connections can be Coloured by RSSI, SNR, 2.4Ghz channel and 5.8Ghz channel. SNR would make a good default option. Visible Radios allow a user to toggle on / off data from one or all radio chipsets. Changing this function can allow a user to see a radio’s ‘offline’ chipset information.