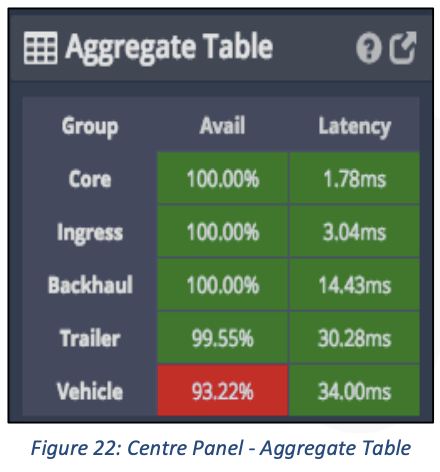
The Aggregate Table keeps track of the current site wide latency and connectivity for the different technology types that have been tagged with the relevant tag.
If latency or availability go beyond a configurable threshold, the cells will turn from green to red. You would hope that all the technology in your site had connectivity as close to 100% as possible. The Vehicle layer, representing the client access layer here, will often fluctuate between 90% and 98% depending on the time of day as operators come in for breaks and shift change.