
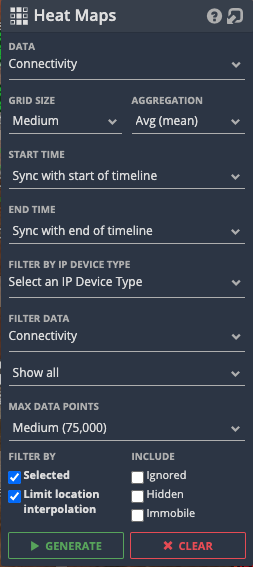
 Heat Map functionality allows a user to see a visualised trail on the map that represents data captured from Assets. The Data drop-down allows the user to select different types of data to Heat Map.
The Heat Map tool shades areas of the Map based on a statistic.
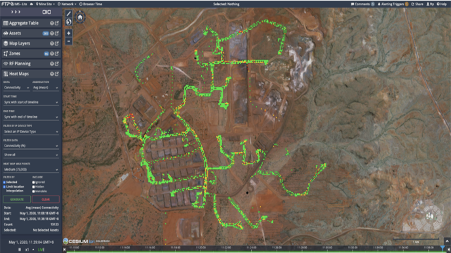
The Heat Map displays an overlay of dots, where each dot shows an aggregation (e.g. average) of data points that were sampled at that location. Each data point is a reference in time, displaying a capture of information from the SME perspective (generally Haul Trucks). It is then plotted on the map with varying colour codes dependant of the quality of the metric. Each colour code is specific to the metric being displayed. Selecting a Heat Map dot will bring up an Infobox which will display all the data points that influence the colouring of the selected dot.
The standard networking Heat Map options available are Connectivity, Latency, Noise, RSSI, SNR, RSRQ, RSRP, SINR, Tx Rate, Rx Rate, Connected AP, and Connected Asset.
Connected Asset is what you would want to use to see which trailers were providing connectivity in areas, and how well cell edges have been defined.
Aggregation works the same as in the Map Options settings Assets, it allows you to average the data of the sample period or to show min/max values for that period.
The Aggregation drop-down allows the user to choose how data points are aggregated for each Heat Map point. For example, if there are 10 data points that fall within the bounds of a single Heat Map point, and the user chooses 'Avg', the colour of the Heat Map point will be calculated from the average value of the 10 data points. The colour of the Heat Map point uses the same colour scale as normal colouring ‘Colour By’ map option for Assets.
The data points in a Heat Map can be filtered:
- Via view / hide state of Assets
- This is the default behaviour when no Assets or IP Devices are selected. By using the view / hide toggle on certain Assets or classes of Asset in the Asset List, you can show only the Assets for which you want to create a Heat Map.
- Start Time / End Time
- This sets the start and end time bounds for collecting data for a HeatMap.
- Filter By IP Device Type
- Only include data from IP Devices that are of the chosen IP Device Type. This is useful when using the show / hide feature to only include certain Assets, but only certain IP Device Types are of interest on those Assets.
- Filter By IP Device Tags
- Only include data from IP Devices that are of the chosen IP Device Tag. This is useful when using the show / hide feature to only include certain Assets, but only certain IP Device Tags are of interest on those Assets.
- Filter Data
- Filter out individual values within the Heat Map in relation to a threshold or value.
- There are a variety of operators depending on the type of the stat column to be filtered upon. When selecting a data field an additional input may appear below where you can then enter the desired threshold value.
- Note: When selecting the Matches Pattern operator this input needs to be a regular expression (RegEx) pattern.
- Max Data Points
- Choose the data point limit for the Heat Map.
- If the limit is exceeded, the Heat Map will be unable to show data for the entire time period.
- Filter By
- Selected
- When checked, only include data from selected Assets and IP Devices. If nothing is selected, this has no effect.
- Limit location interpolation
- When checked, only include data points that have a timestamp that is within a time interval of a location timestamp.
- This value defaults to 10 seconds but can be customised for your IMS instance. Ask the FTP team for more details.
- When un-checked, IMS will search as far into the past as possible for a location to use to place the data point on the map.
- Selected
- Include
- Ignored
- Only applicable to Network Statistics like Connectivity.
- When checked, include Network Stats that have been marked as ignored.
- Hidden
- When checked, include Assets that have been hidden in the Assets List.
- Immobile
- When checked, include Assets that are immobile e.g. Trailers and Towers.
- Ignored
By default, Heat Maps can contain up to 75000 data points. If this limit is exceeded the user will receive a warning and only the first 75000 data points will be shown. This option can be changed in the drop-down menu but may have performance impacts on the application.
Heat Maps in Underground Sites
Heat maps can be generated and viewed in the underground as well on the surface. When viewed underground the heat map is shown as cubes as in the below example.

Only the portion of the heat map relevant to the currently visible layers is shown; the entire heat map can be viewed by showing the full-site layer or by toggling on individual layers. In the example below two layers are visible and you can see the heat map for each is shown with them.

Also note that heat maps can be generated on the surface or in the underground but not covering both at the same time. So you can generate a surface heat map but it will not contain any data for the underground and vice versa.